Summary
Run the numbers and the marketing appears sound: monthly returns of pooled mortgage funds show a correlation to shares near zero, with return lines smooth enough to frame. This paper examines which parts of that picture are real, and it starts with the part that is a measurement artefact, because a fund manager’s claims are worth more when the weakest one has been dealt with first.
Plain English · correlation
Correlation measures how much two investments move together, from +1 (always together) through 0 (no relationship) to -1 (always opposite). A low correlation holding is valuable because it can steady a portfolio. The catch is that correlation is computed from measured price movements, so an asset whose price is never measured scores near zero automatically.
That catch is the whole first section. A mortgage fund’s loans are carried at their face value plus interest owed. Between the day a loan settles and the day it repays, no market price exists, so months in which the property market moved appear in the fund’s return line as calm. Statistics computed on that line describe the accounting method, and critics who label the result volatility laundering have identified a real problem with how the sector presents itself.1
Section 02 sets out what remains once the statistic is set aside, because something real does: the income is contractual, the security is registered and first ranking, and a loss of principal requires two things to happen to the same loan, a borrower default and a fall through roughly 35 points of borrower equity. Section 03 states the claim we make instead of uncorrelated, in full, with the published numbers that let an investor check it.
What this paper does not claim: that a severe recession would leave the fund untouched. Arrears would rise, terms would extend, and in a deep enough downturn paired with defaults, losses are possible. The difference between us and an equity allocation in that scenario is the 35 cents of someone else’s capital that burns first, and we would rather describe that mechanism precisely than borrow a word like uncorrelated to gesture at it.
~0
Measured correlation, and why it flatters
2
Events a principal loss requires, jointly
35c
Borrower equity that absorbs falls first
10
Published numbers that make it checkable
Section 01
The flattering statistic.
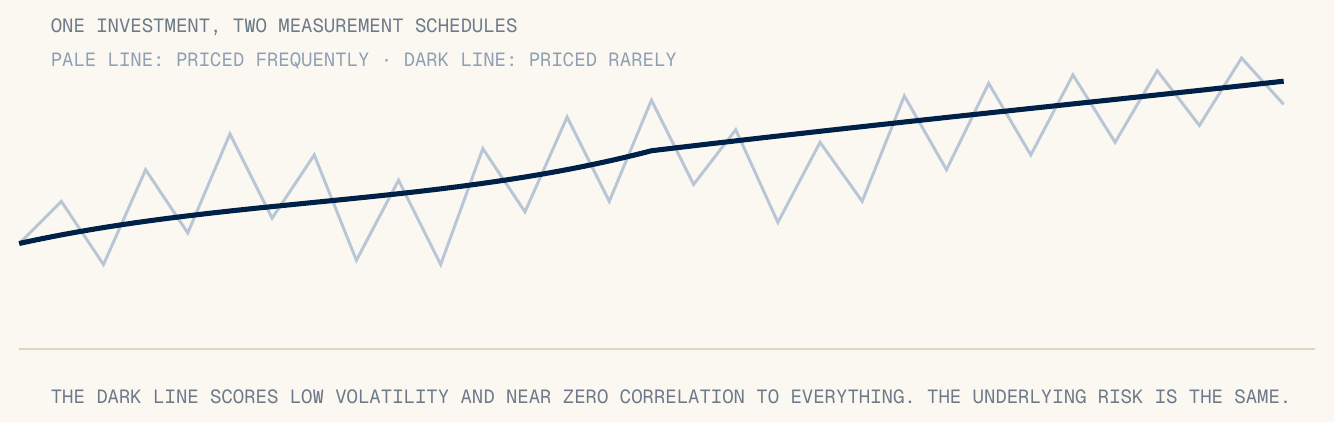
Take one investment with a genuinely bumpy path and measure its value on two schedules. Priced every day, it shows its full ups and downs. Priced once a quarter, most of the movement nets out between measurements and the reported line comes out smooth. The investment is identical in both cases; the difference is entirely in how often someone looked.
| How the asset is priced | Reported volatility | Reported correlation to shares |
|---|---|---|
| Listed share, priced continuously | Full | Whatever it truly is |
| Unlisted property fund, valued quarterly | Reduced | Understated |
| Loan at face value, never repriced | Near zero | Near zero, by construction |
A pooled mortgage fund sits in the last row. Its unit price is built from loans at face value plus accrued interest, so the published return line stays smooth through months when the property market, and with it the resale value of the fund’s collateral, moved materially. A correlation statistic computed on that line measures the bookkeeping. Critics who call this volatility laundering are correct about the statistic, and a manager who leads a pitch with a correlation matrix built on unpriced assets is selling the bookkeeping.1
Section 02
What remains after the concession.
Setting the statistic aside, three structural facts about a first mortgage remain true, each of them checkable rather than statistical.
| Structural fact | What it means | Where it is checkable |
|---|---|---|
| The income is contractual | Interest accrues at a stated rate to a stated date, whatever the mood of any market that month. An index fund’s monthly result depends on prices; a loan’s monthly income depends on an invoice being paid. | The loan documents; arrears line of the quarterly table |
| The security is registered and first ranking | Recovery runs through the legal queue of Paper 05, from the front of it, against a property valued independently at origination. | The land titles register, loan by loan |
| A principal loss needs two events at once | The borrower must default, and the sale must fall short after roughly 35 points of borrower equity and the costs in Paper 04‘s arithmetic. A share index repricing requires no default anywhere, as June 2026 demonstrated at a cost of about US$2 trillion. | Papers 04 and 05, and the arrears and LVR lines of the quarterly table |

These mechanics produce genuine steadiness of a specific, limited kind: steadier cash income, and losses that are structurally rare rather than statistically invisible. That is a smaller claim than uncorrelated, and it has the advantage of remaining true when someone checks.
Section 03
The claim we make instead.
| The claim we decline to make | The claim we make | |
|---|---|---|
| Wording | “Uncorrelated with equities” | Contractual income; losses require default and collateral shortfall together |
| Evidence offered | Correlation computed on unpriced assets | LVRs, arrears, ranking, valuations and extensions, published quarterly per Paper 06 |
| In a severe recession | The word fails, publicly | The numbers show the stress as it happens, which is the point of publishing them |
Written out in full, the claim reads as follows. The fund’s returns are expected to be steady because the income is contractual and a loss of principal requires a default and a collateral shortfall on the same loan. In a severe downturn, arrears rise, some loans extend, and losses are possible once roughly 35 points of borrower equity are used up, loan by loan. Every part of that sentence maps to a number in the quarterly disclosure table: the LVR distribution measures the equity, the arrears lines measure the stress, the ranking line confirms the queue position, the valuation policy supports the denominator, and the extension rate separates loans that repaid from loans that rolled.
A recession reaches every asset class, including this one, and Paper 02 sets out the order in which it does so. What protects a senior secured lender in that scenario is a set of mechanisms that can be named, measured and published: seniority, registered security, short terms, and a buffer of borrower equity that absorbs losses first. Smooth return lines are a by-product of the accounting. The mechanisms are the product, and they hold up under examination, which is the standard this whole series is written to.
Sources and method.
- The volatility laundering critique as made publicly by practitioners and academics writing on private asset return smoothing; the term is used here with attribution to its critics.
- Cross references within this series: Paper 02 for the June 2026 equity episode; Paper 04 for the loss arithmetic; Paper 05 for the recovery queue; Paper 06 for the quarterly disclosure list.
Method notes.
Figure 1 is a constructed example: one simulated path sampled at two frequencies, drawn to show the mechanism only; it depicts no fund, index or asset, and no magnitudes should be read from it. Statements about mortgage fund correlation describe the generic accounting treatment of loans at amortised cost and are not measurements of any particular fund, including this one. The 35 point equity figure refers to origination LVRs of 65 to 70 per cent under the fund’s mandate and reduces as arrears and costs accrue during a workout, per Paper 04. The two part loss test in Figure 2 uses Paper 04‘s exposure figure of $71.30 per $65 lent at realisation. Figures may not sum exactly due to rounding.
Disclosure.
This paper is issued by Oxford Capital Pty Ltd (ACN 700 065 872). Oxford Capital Pty Ltd is the investment manager of the fund and a corporate authorised representative (CAR No. 1323556) of Non Correlated Advisors Pty Ltd ACN 158 314 982, AFSL 430126. It does not hold an Australian Financial Services Licence of its own. The trustee of the fund, and the issuer of units in it, is Non Correlated Capital Pty Ltd ABN 99 143 882 562, AFSL 499882. This document is general information and commentary only. It is not financial product advice, does not take into account any person’s objectives, financial situation or needs, and is not an offer or invitation to acquire any financial product. Any interest in a fund managed by Oxford Capital will be offered only to wholesale or sophisticated investors within the meaning of the Corporations Act 2001 (Cth). Oxford Capital is a lender against Australian property and has an interest in investors considering private credit; readers should weigh this paper accordingly. Figures are drawn from third party sources believed reliable but not independently audited. Past performance is not an indicator of future performance. Nothing here is a statement that any investment is safe or that capital is protected.
OC-RP-09 · August 2026 · Second edition