Summary
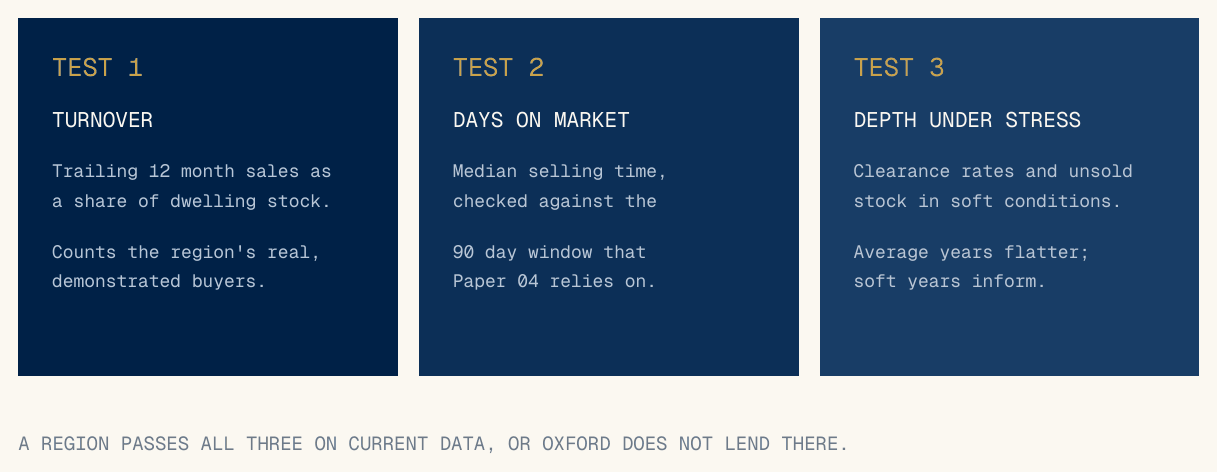
Paper 04‘s stress test assumes a defaulted property sells within a nine month workout, with the marketing campaign itself inside roughly ninety days. That assumption is carrying the whole structure, so it should be tested region by region rather than taken on trust. The good news is that the evidence is public: property markets publish their own liquidity statistics every month.
| Measurement | What it tells you | Where it comes from |
|---|---|---|
| Turnover | Sales in the past year as a share of all dwellings in the region. This counts the buyers who actually showed up. | Cotality sales records against ABS dwelling stock, by SA3 region |
| Days on market | The median time a property takes to sell. This is the direct test of the ninety day window. | Cotality listings data, monthly |
| Depth under stress | What happens to clearance rates and unsold stock when conditions soften, as they are now. | Published auction results and total listings, monthly |
Plain English · SA3, the map unit
The ABS divides Australia into statistical regions. An SA3 covers roughly 30,000 to 130,000 people, about the size of a council area or a familiar chunk of a city. Greater Sydney contains around 45 of them. Measuring at SA3 level is fine grained enough to matter and coarse enough that the data stays reliable.
A region must pass all three tests, on current data, before Oxford lends against property in it. Section 02 explains how the tests become a published map, and Section 03 covers the 1990 episode that the framework is built to respect.
What this paper does not claim: that any suburb is immune to illiquidity. In 1990 there were postcodes where nothing sold at any price for months; the paper includes them.
90
Days, the sale window being tested
3
Tests a region must pass
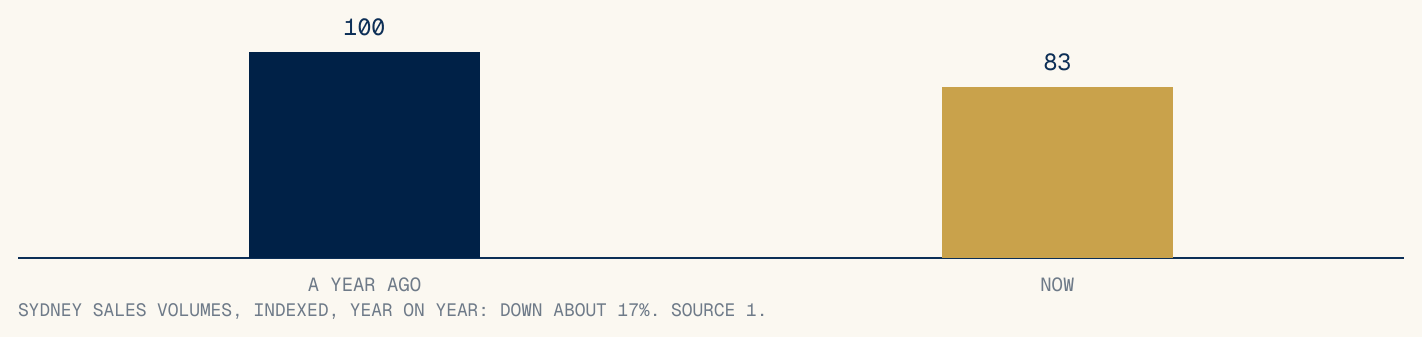
-17%
Sydney sales volumes, year on year
~45
SA3 regions across Greater Sydney
Section 01
Buyer depth, with expensive examples.
Prestige and liquidity are different properties of a suburb, and lenders care about the second one. Some of Sydney’s most admired addresses transact a handful of times a year, through long private campaigns, at prices reached by negotiation between a small number of qualified buyers. Plenty of middle ring regions, meanwhile, turn over their housing stock steadily every month of every year. For a lender who may one day need a sale inside ninety days, the second market is the safer collateral, whatever the postcodes suggest socially.
| Profile, illustrative only | High turnover middle ring region | Prestige enclave |
|---|---|---|
| Turnover, sales as % of stock per year | Consistently high | Low, a thin trickle |
| Median days on market | Well inside the 90 day window | Often beyond it, campaigns run long |
| Behaviour in soft years | Volumes dip, sales continue | Sellers withdraw, the market can go quiet |
| Suitability as forced sale collateral | Strong | Weak, whatever the price tag |
Section 02
From three tests to a published map.
| Map tier | Meaning | Lending consequence |
|---|---|---|
| PASSES | All three tests met on current data | Eligible for lending at standard terms |
| WATCH | Passes on trend, thins under stress | Case by case, with lower LVR or additional conditions |
| DOES NOT PASS | Fails one or more tests | No lending, at any price or LVR |
The map and the full SA3 table, showing every region’s three readings for the month, will be published beside this paper and regenerated monthly from the same Cotality, ABS and auction data that feed the Sydney Mortgage Monitor. Publishing the criteria makes them checkable: an investor holding our loan list can look up any security’s region on the map for its month, and raise any exception through the disclosure table in Paper 06. The 15 kilometres in the title records where this framework began, as an instinct about staying close to the CBD. The tests replaced the instinct with arithmetic, and the arithmetic is the rule. Our initial lending concentration is Greater Sydney; where the fund’s mandate takes it further, the same three tests apply, on the same published data, wherever the security sits.
Section 03
1990, kept in the model.
In the downturn that followed the late 1980s boom, with lending rates near 17 per cent, parts of Sydney recorded months in which no sales settled at all. A days on market statistic has no value to report when nothing sells, and that silence is the most important data point in this paper. Liquidity in property is usually low and occasionally absent, and a framework that only contemplates low is incomplete.
| What 1990 established | How the framework answers it |
|---|---|
| Whole postcodes can stop transacting for months | Test 3 scores regions on their soft year behaviour, and regions with a history of going quiet score poorly in exactly those conditions. |
| Illiquidity arrives fastest where buyer depth was thinnest | Tests 1 and 2 keep the book out of thin markets before the downturn, which is the only time the choice is available. |
| Sometimes the sale simply takes longer than any plan | Paper 04‘s arithmetic charges nine months of arrears and costs, and the loan’s protection in a true freeze is the 35 points of borrower equity and the absence of investor redemption terms that would force a sale into an empty market. |
The honest limit of the framework belongs in its own sentence: the three tests reduce the chance of holding security in a market that freezes, and no measurement can reduce that chance to zero. What the tests can do is prove, monthly and in public, that the book is being kept where the buyers demonstrably are, and that the ninety day assumption underneath every recovery number in this series is being checked against live data rather than asserted once and retired.
Sources and method.
- Cotality (formerly CoreLogic) hedonic index and transaction records, Sydney: sales volumes about 17 per cent below a year earlier, per our house view of August 2026; SA3 level turnover and days on market series.
- ABS dwelling stock estimates by SA3 under the Australian Statistical Geography Standard; published auction clearance series for Greater Sydney.
- Contemporaneous reporting and practitioner records of the 1989 to 1991 downturn.
Method notes.
Turnover is trailing twelve month settled sales divided by estimated dwelling stock. Days on market is the median for sold listings. Depth under stress combines auction clearance rates and the change in total stock on market over the trailing year. Numeric thresholds for each test are published alongside the map rather than fixed in this text, so that any recalibration is visible. The profiles in Section 01’s table are illustrative and unnamed; the map, once published, scores actual SA3 regions with the month’s data. Figures may not sum exactly due to rounding.
Disclosure.
This paper is issued by Oxford Capital Pty Ltd (ACN 700 065 872). Oxford Capital Pty Ltd is the investment manager of the fund and a corporate authorised representative (CAR No. 1323556) of Non Correlated Advisors Pty Ltd ACN 158 314 982, AFSL 430126. It does not hold an Australian Financial Services Licence of its own. The trustee of the fund, and the issuer of units in it, is Non Correlated Capital Pty Ltd ABN 99 143 882 562, AFSL 499882. This document is general information and commentary only. It is not financial product advice, does not take into account any person’s objectives, financial situation or needs, and is not an offer or invitation to acquire any financial product. Any interest in a fund managed by Oxford Capital will be offered only to wholesale or sophisticated investors within the meaning of the Corporations Act 2001 (Cth). Oxford Capital is a lender against Australian property and has an interest in investors considering private credit; readers should weigh this paper accordingly. Figures are drawn from third party sources believed reliable but not independently audited. Past performance is not an indicator of future performance. Nothing here is a statement that any investment is safe or that capital is protected.
OC-RP-07 · August 2026 · Second edition