Summary
A stress test answers one question: if things go wrong in a specific, stated way, what happens to the money? This paper runs that question against a single representative loan, $65 lent against a property independently valued at $100, written for twelve months, which is the standard shape of an Oxford loan.1
The loan being tested
| Property value at origination | $100, set by an independent valuer |
| Loan amount | $65, a loan to value ratio (LVR) of 65% |
| Security | First registered mortgage (first in line to be repaid; Paper 05 explains the queue) |
| Term and rate | 12 months, borrower rate near 10% a year |
| What we assume goes wrong | The borrower defaults and the property must be sold in a falling market |
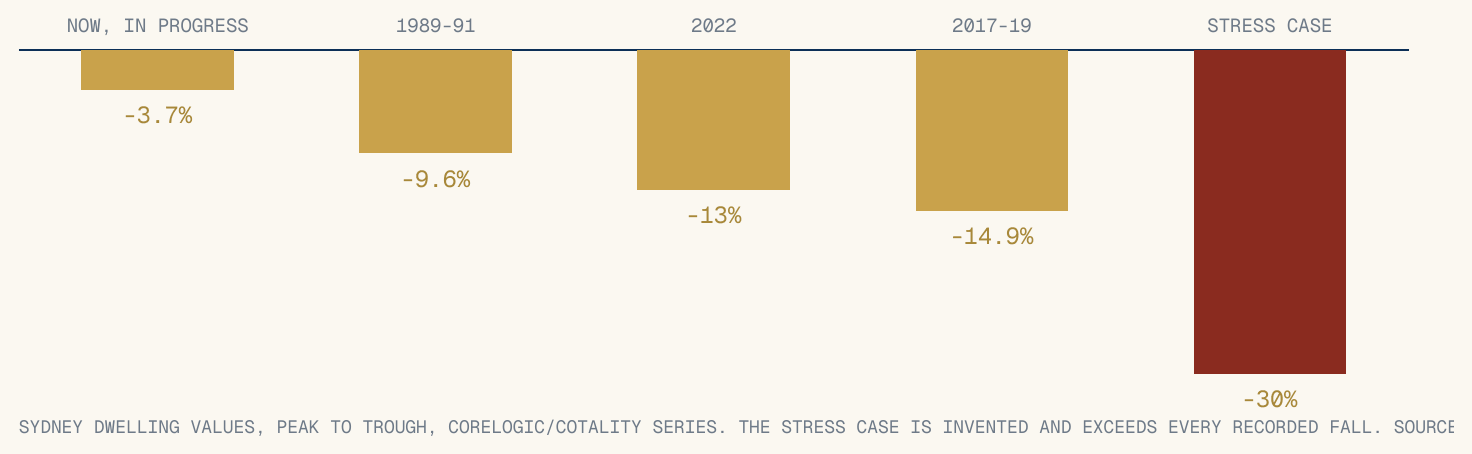
The test sells that property at the bottom of the 1989 to 1991 downturn (Sydney fell 9.6 per cent), the 2017 to 2019 downturn (14.9 per cent), and the 2022 downturn (about 13 per cent), then at the bottom of a hypothetical 30 per cent fall, which has no precedent in Sydney’s modern records.2,3,4 Section 03 reports all four outcomes, including the one where the lender loses money.
What this paper does not claim: that capital is protected, or that a severe enough correction, paired with borrower default, cannot produce a loss.
-3.7%
Sydney, from peak, as we write
-14.9%
Largest modern fall, 2017-19
-30%
The invented stress case
$35
Borrower equity per $100, the buffer
Section 01
Sydney’s actual record of falling.
Sydney property falls less often, and less far, than people arguing about it assume, and the falls it has recorded are the honest starting point for any stress test. The chart shows every citywide peak to trough decline in the modern index series, plus the current one in progress, plus the invented case this paper tests against.
Plain English · why test beyond the record
A test that only covers past falls assumes the future stays inside the past’s boundaries. Doubling the worst recorded fall is a standard way to check what happens if it does not. It is a what-if calculation, and this paper labels it that way throughout.
One structural point before the arithmetic. Oxford loans run for twelve months. The falls in the chart took between one and two years to happen. A short term limits how much of any downturn can occur between the day the property is valued and the day the loan is due, and the test below ignores this advantage on purpose, applying each full peak to trough fall to a single loan.
Section 02
Counting every cost of a forced sale.
A defaulted loan costs more to recover than its face value, and a stress test that skips those costs is advertising. Ours charges three of them. Selling costs, agent, marketing and legal, at 2.5 per cent of the sale price. Interest arrears, because a defaulting borrower has stopped paying: nine months at the borrower rate adds about $4.80 to the $65. And enforcement, legal and holding costs of about $1.50. By settlement day the lender needs about $71.30 back to be made whole.
Build-up of the lender’s exposure
| Loan at origination | $65.00 |
| Interest arrears, 9 months at ~10% a year | + $4.80 |
| Enforcement, legal and holding costs | + $1.50 |
| Total exposure at settlement | $71.30 |

Plain English · nine months, explained
Nine months from default to settlement is deliberately slower than a normal sale. It covers the default notice period, appointing agents, a full marketing campaign in a soft market, and settlement. Forced sales that run faster than this improve every number in the next section.
Section 03
Four sales, four outcomes.
| Scenario | Sale price | After 2.5% selling costs | Lender’s exposure | Result |
|---|---|---|---|---|
| 1989-91 fall, -9.6% | $90.40 | $88.14 | $71.30 | Repaid in full. $16.84 left over for the borrower. |
| 2022 fall, about -13% | $87.00 | $84.83 | $71.30 | Repaid in full. $13.53 to the borrower. |
| 2017-19 fall, -14.9% | $85.10 | $82.97 | $71.30 | Repaid in full. $11.67 to the borrower. |
| Stress case, -30% | $70.00 | $68.25 | $71.30 | Shortfall of $3.05. A loss of 4.7% of the loan. |
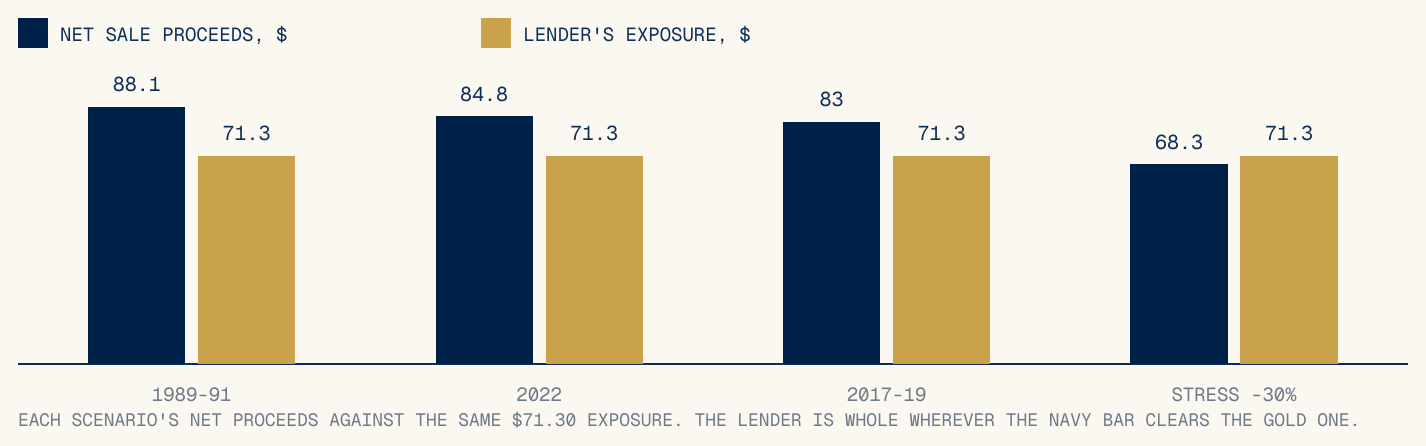
Both findings should be read together. In each downturn Sydney has actually recorded, a defaulted 65 per cent loan, sold slowly and charged every cost, repays in full. In a 30 per cent fall the loss is real and it is $3.05, because $28.70 of borrower equity absorbed the fall first. The security’s job is to keep losses small and rare. On this test it does that job, and the number for the extreme case is printed rather than rounded away.
Section 04
The number that drives everything, and the caveats.
Every result above depends on the starting LVR. The table below reruns the identical 30 per cent stress at higher starting LVRs, holding all other assumptions fixed, and it is the strongest argument in this paper for why the origination discipline matters more than the workout skill.
| Starting LVR | Exposure at settlement | Net proceeds at -30% | Loss on the loan |
|---|---|---|---|
| 65% (Oxford standard band starts here) | $71.30 | $68.25 | 4.7% |
| 70% (top of Oxford band) | $76.70 | $68.25 | 12.1% |
| 75% | $82.10 | $68.25 | 18.4% |
| 80% | $87.40 | $68.25 | 23.9% |
Four caveats complete the test honestly. First, citywide indices are averages, and an individual property can fall further than its city; the valuation and the location rules in Paper 07 exist for this reason. Second, defaults and price falls tend to arrive together, which is why the test assumes the default outright in every scenario rather than applying a probability to it. Third, a contested enforcement can run longer than nine months, and each extra month adds arrears to the exposure line. Fourth, recovery beyond the property, pursuing the borrower personally, is excluded from every figure here, and anything it produced would improve the stress case result.
Sources and method.
- Cotality (formerly CoreLogic) hedonic index, Sydney dwellings, per our house view of August 2026: about 3.7 per cent below peak, sales volumes down about 17 per cent year on year.
- CoreLogic, as reported: Sydney peak to trough decline of 9.6 per cent, 1989 to 1991.
- CoreLogic: Sydney peak to trough decline of 14.9 per cent, July 2017 to mid 2019.
- CoreLogic, as reported January 2023: Sydney peak to trough decline of approximately 13 per cent across 2022.
Method notes.
Assumptions: loan of $65 per $100 of independent valuation at origination; borrower rate 9.9 per cent a year; default at term; nine months from default to settlement; arrears accrue simple on the loan balance, $4.80 at 65 LVR and proportionally at higher LVRs; enforcement, legal and holding costs $1.50 in all cases; selling costs 2.5 per cent of the price achieved. Each scenario applies the full published peak to trough fall to the origination valuation, an intentionally adverse timing assumption given the twelve month term. Loss percentages divide the shortfall by the loan amount. The 2022 figure is the decline reported at the January 2023 trough. Recovery against the borrower personally is excluded. Figures may not sum exactly due to rounding.
Disclosure.
This paper is issued by Oxford Capital Pty Ltd (ACN 700 065 872). Oxford Capital Pty Ltd is the investment manager of the fund and a corporate authorised representative (CAR No. 1323556) of Non Correlated Advisors Pty Ltd ACN 158 314 982, AFSL 430126. It does not hold an Australian Financial Services Licence of its own. The trustee of the fund, and the issuer of units in it, is Non Correlated Capital Pty Ltd ABN 99 143 882 562, AFSL 499882. This document is general information and commentary only. It is not financial product advice, does not take into account any person’s objectives, financial situation or needs, and is not an offer or invitation to acquire any financial product. Any interest in a fund managed by Oxford Capital will be offered only to wholesale or sophisticated investors within the meaning of the Corporations Act 2001 (Cth). Oxford Capital is a lender against Australian property and has an interest in investors considering private credit; readers should weigh this paper accordingly. Figures are drawn from third party sources believed reliable but not independently audited. Past performance is not an indicator of future performance. Nothing here is a statement that any investment is safe or that capital is protected.
OC-RP-04 · August 2026 · Second edition