Summary
The CAPE ratio compares the price of the US sharemarket with the average of its last ten years of company earnings, adjusted for inflation. In July 2026 it closed above 42. The only higher reading since records begin in 1881 came at the peak of the dot-com boom, 44.2 in December 1999.1
Plain English · CAPE, in one sentence
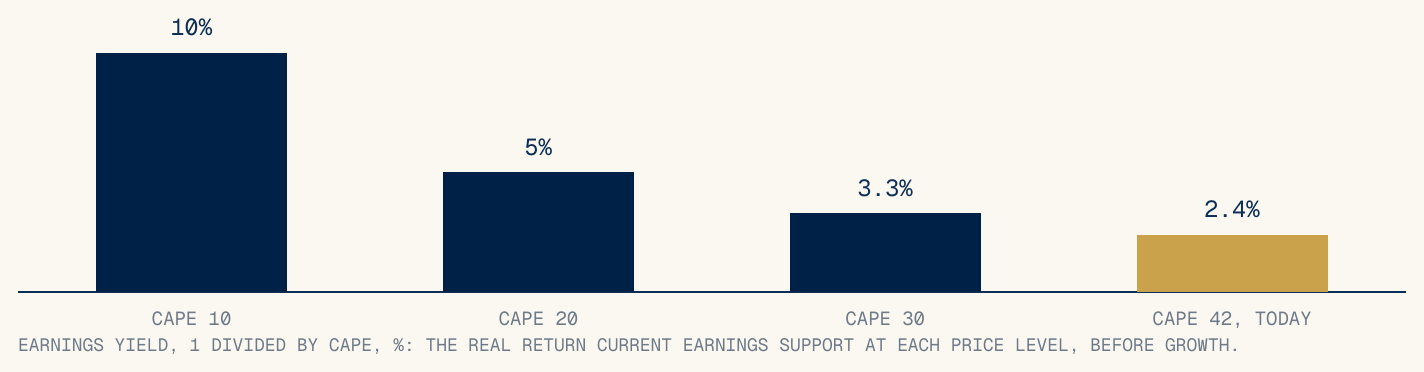
CAPE answers the question: how many dollars am I paying for each dollar of the market’s proven, averaged earning power? At 42, the answer is 42, and the market’s earnings currently support a return of about 2.4 per cent a year in real terms (1 divided by 42) before any growth.
A reading of 42 is not a prediction of a crash, and Section 03 documents how badly CAPE performs as a timing tool. What the reading does is set the arithmetic for the decade ahead. An equity investor’s ten year return comes from three sources: dividends received, growth in company earnings, and any change in the price multiple future investors are willing to pay. At a starting multiple of 42, the third source needs future investors to keep paying close to record prices merely for the return to keep pace with earnings.1,2
A lender’s return has a different construction. The rate, the repayment date and, for a mortgage, the registered security are set in the contract at settlement. The best case equals the contract, the worst case is a default net of what the security recovers, and there is no third source that depends on anyone’s future enthusiasm. This paper puts both constructions side by side with the numbers attached, and applies the same honesty to credit that it applies to shares: a lender who accepts a thin rate at entry has locked in a thin decade with the same certainty.
What this paper does not claim: that equities should be sold, or that CAPE times anything. It first crossed its 1929 level in 1996, four years early. Credit has its own version of the same law, since a tight starting spread predicts thin credit returns exactly as a high starting multiple predicts thin equity returns. The honest statement is symmetrical: in both markets, the price paid at entry is most of the return story, and only one of the two writes that return into a contract.
42
CAPE, July 2026 close
44.2
The only higher reading, Dec 1999
2.4%
Real return today’s earnings support
0-3%
Historical decade band from readings above 35
Section 01
Where 42 sits in 145 years.
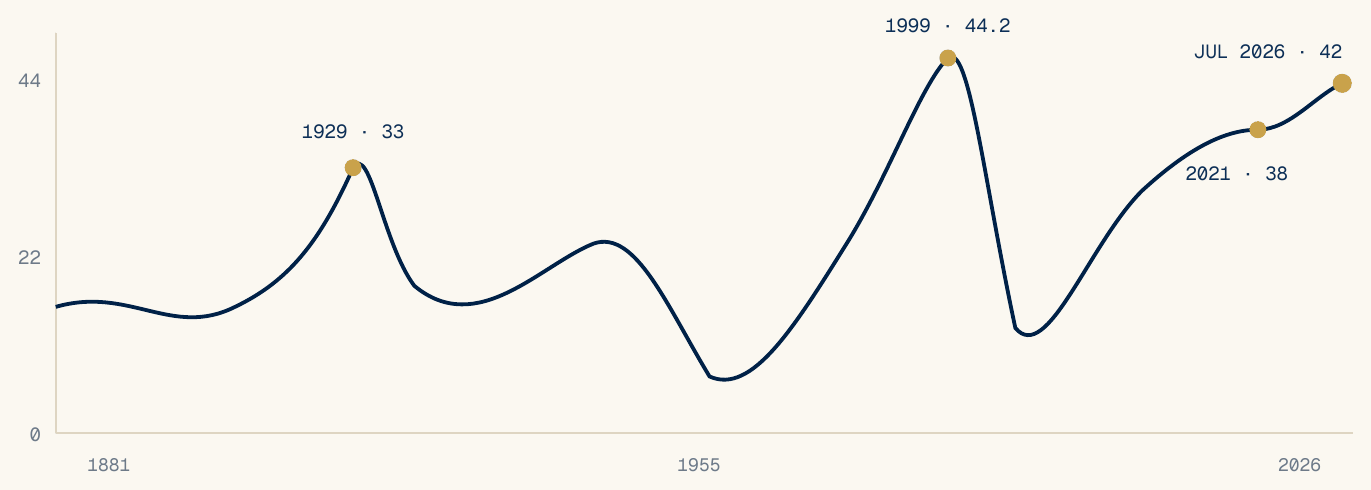
The historical record from starting points like today’s is a spread of outcomes rather than a single number. Taking every month since 1881 with a CAPE reading above 35 and measuring the ten years that followed produces annualised real returns mostly between zero and 3 per cent, with wide variation inside that range, including negative decades.1,2 The spread describes uncertainty honestly: buying at high multiples has usually led to thin decades, and occasionally to worse ones, and the record contains no example of it reliably leading to strong ones.
Section 02
Two ways of being paid.
Break each investment’s ten year outcome into where the money actually comes from and the difference between hoping and buying becomes a spreadsheet rather than a slogan.
| Source of return | Broad US shares at CAPE 42 | First mortgage held to term |
|---|---|---|
| Contracted payments | Dividends, currently modest at these prices | Interest at the loan rate, monthly, under contract |
| Growth | Real earnings growth, historically a few per cent a year | None. The contract is the ceiling. |
| The next buyer’s mood | The multiple in 2036: today’s return maths needs it to stay near record levels | Not applicable. Repayment at face value ends the loan. |
| What causes a permanent loss | Paying a multiple that later falls, no company failure required | Borrower default combined with the security selling short, per Paper 04‘s arithmetic |
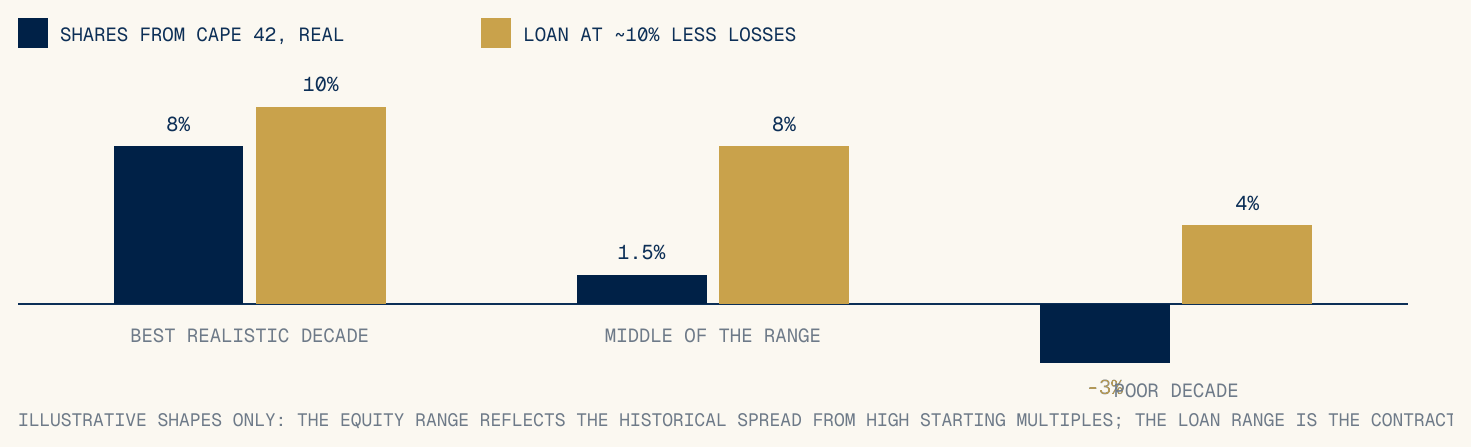
Both shapes have a place in a portfolio. Shares keep the possibility of strong decades, and a portfolio without them gives that up. Loans convert the range into a known rate with a limited tail. The point of the comparison is knowledge at purchase: one investor can state their expected return by reading a contract, and the other is making an estimate about earnings and about the buyers of 2036.
Section 03
Two warnings, one for each market.
The first warning concerns timing, and it comes from CAPE’s own record. The ratio first rose above its 1929 peak in 1996. The market then roughly doubled over the following four years before the 2000 fall. An investor who sold on the 1996 signal missed those years entirely, and one who shorted lost money for four consecutive years. Valuation measures altitude with reasonable accuracy and says almost nothing about dates. This paper uses CAPE for arithmetic and offers no view on when anything happens.1
| The pricing law | Equity version | Credit version |
|---|---|---|
| The expensive starting point | High multiple: CAPE above 35 | Thin rate: a lending market that has bid margins down |
| What it predicts | Thin decade returns, with variation | Thin credit returns, with the tail still attached |
| The discipline that answers it | Attention to the price paid at entry | Declining loans that do not pay for their risk, and saying so |
The second warning is the credit version of the law, and it applies to us. A lender’s equivalent of a 42 multiple is a rate that has been competed down until it no longer pays for the risk carried. A private credit market receiving large inflows can do this to itself, and a manager quoting valuation discipline at equity investors while cutting rates to win loans has abandoned the same discipline at home. Oxford’s structural answers are on the record: the fund’s target is built as a margin over the cash rate, borrower pricing starts where the risk requires, and in periods when the market will not pay adequate rates, the fund’s stated course is to lend less, hold more cash, and show the resulting numbers in the quarterly disclosure table of Paper 06. The price paid at entry is most of the return story in both markets, and the contract a lender holds is worth what the entry price preserved.
Sources and method.
- Robert Shiller, online data for Irrational Exuberance: monthly S&P composite prices, earnings and CAPE from 1881; July 2026 close above 42; peaks of 44.2 in December 1999 and about 33 in 1929; the 1996 crossing of the 1929 level.
- Ten year forward real returns by starting CAPE, computed from the same dataset.
Method notes.
CAPE divides the index price by the trailing ten year average of inflation adjusted earnings; the earnings yield is its reciprocal, about 2.4 per cent at 42. The zero to 3 per cent band summarises annualised real total returns over the ten years following monthly readings above 35; the distribution is wide and includes negative outcomes, and it describes history rather than forecasting. Figure 1’s path is stylised between sourced markers. Figure 3 is labelled illustrative: the equity bars mark points inside the historical spread from high starting multiples, and the loan bars show a contract rate near 10 per cent reduced by nil, moderate and severe loss scenarios consistent with Paper 04‘s stress arithmetic; neither set is a projection of any actual investment, and the fund’s returns are not implied by them. Figures may not sum exactly due to rounding.
Disclosure.
This paper is issued by Oxford Capital Pty Ltd (ACN 700 065 872). Oxford Capital Pty Ltd is the investment manager of the fund and a corporate authorised representative (CAR No. 1323556) of Non Correlated Advisors Pty Ltd ACN 158 314 982, AFSL 430126. It does not hold an Australian Financial Services Licence of its own. The trustee of the fund, and the issuer of units in it, is Non Correlated Capital Pty Ltd ABN 99 143 882 562, AFSL 499882. This document is general information and commentary only. It is not financial product advice, does not take into account any person’s objectives, financial situation or needs, and is not an offer or invitation to acquire any financial product. Any interest in a fund managed by Oxford Capital will be offered only to wholesale or sophisticated investors within the meaning of the Corporations Act 2001 (Cth). Oxford Capital is a lender against Australian property and has an interest in investors considering private credit; readers should weigh this paper accordingly. Figures are drawn from third party sources believed reliable but not independently audited. Past performance is not an indicator of future performance. Nothing here is a statement that any investment is safe or that capital is protected.
OC-RP-08 · August 2026 · Second edition