Summary
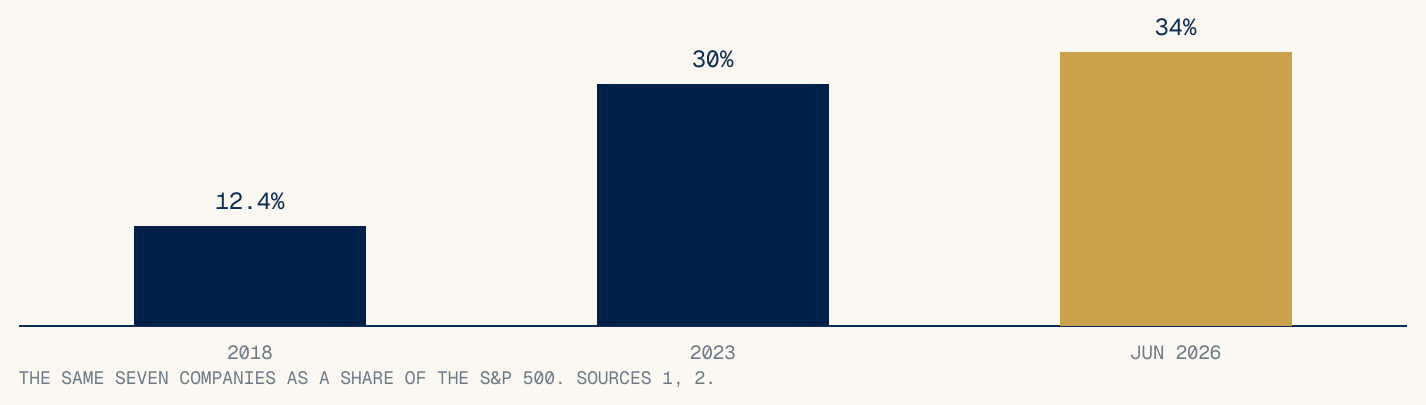
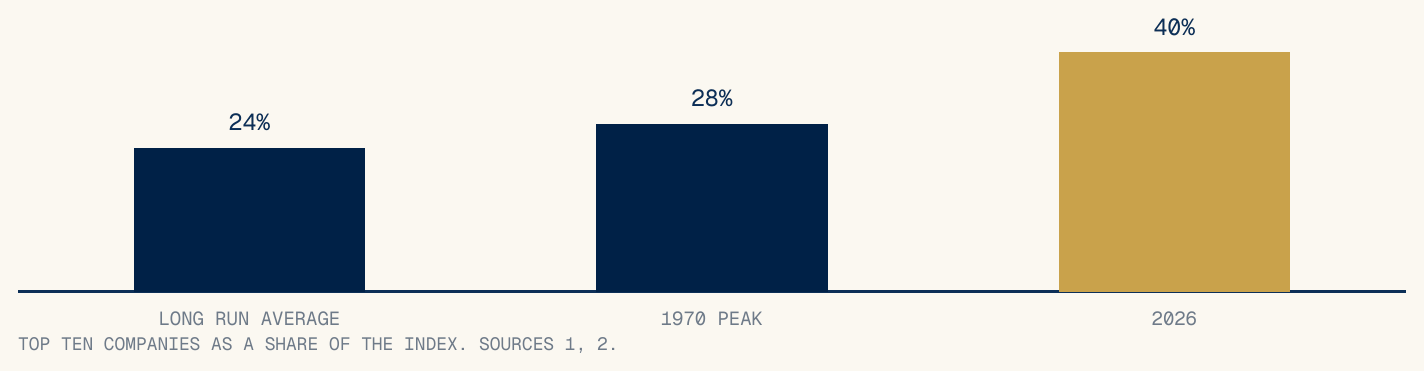
The Magnificent Seven is the market’s nickname for Apple, Microsoft, Alphabet, Amazon, Nvidia, Meta and Tesla. As at June 2026 these seven companies made up roughly 34 per cent of the S&P 500. Eight years earlier the same seven were 12.4 per cent. Adding the next three largest companies takes the top ten to about 40 per cent of the index, the heaviest concentration in modern records, ahead of the previous high of 28 per cent set in 1970.1,2
Plain English · why this reaches your super
Most balanced super options hold international shares through index funds that weight companies by size. The bigger a company grows, the more of it the fund holds. This is automatic and nobody at the super fund is picking these stocks. Section 02 works out the dollars.
Concentration is a measurement, not a verdict. The market has rewarded these companies for a decade and may keep doing so. The number matters because it tells an investor how much of their portfolio depends on one group of companies doing well, and June 2026 supplied a live demonstration: the seven lost roughly US$2 trillion of combined value in the weeks after the market’s early June peak, and the index followed them down even though the average American stock rose over the same stretch.3,4
The record for the half year as a whole ran the other way, and this paper reports it with equal weight: across the first six months of 2026 the seven, as a group, returned about 4 per cent while the index returned close to 10, and only one of the seven beat the index.5,6
What this paper does not claim: that a correction is imminent, or that private credit is uncorrelated with the economy. A recession reaches everyone; seniority and security determine in what order.
34%
Seven companies’ share of the S&P 500
12.4%
The same seven, eight years earlier
~40%
Top ten share of the index
~$7
Of every $100 in a balanced option, in the seven
Section 01
How heavy the top has become.
An index fund weighted by company size buys more of whatever has already grown. For most of history this design spread money across hundreds of companies in sensible proportions. Over the past eight years it has concentrated money at the top at a pace with few precedents.
| Company | Main business | What its valuation leans on |
|---|---|---|
| Apple | Phones, devices, services | Different businesses, but the big |
| Microsoft | Software, cloud, AI | valuations share a few common assumptions: continued heavy |
| Alphabet | Search, advertising, cloud | spending on AI infrastructure that eventually pays for itself, |
| Amazon | Retail, cloud computing | low enough interest rates to support high prices for future |
| Nvidia | AI chips | profits, and the current leaders staying in front. When investors |
| Meta | Social media, advertising | mark down one of those assumptions, the seven tend to |
| Tesla | Electric vehicles | move together. |
Section 02
The dollars in an ordinary balanced option.
Follow one hundred dollars through a typical Australian balanced super option. Around $30 goes to international shares. About 70 per cent of the standard international index is the United States, so roughly $21 of the $30 lands there. About a third of the US market is the seven companies. The arithmetic is three multiplications, shown below.1,7

| Balance in a balanced option | Amount in the seven companies | Amount in the US top ten |
|---|---|---|
| $100,000 | ~$7,100 | ~$8,400 |
| $250,000 | ~$17,900 | ~$21,000 |
| $500,000 | ~$35,700 | ~$42,000 |
| $1,000,000 | ~$71,400 | ~$84,000 |
Seven per cent in seven companies is a defensible position, and plenty of investors would choose it deliberately. The measurement matters because most holders have not chosen it, do not know the size, and meet the number for the first time in a month like June 2026.
Section 03
June 2026, and the half year around it.
The US market set a record in early June 2026 and then fell back. Over the following weeks the seven companies lost roughly US$2 trillion of combined market value. The fund that tracks the group fell more than 8 per cent, the main semiconductor index fell more than 19 per cent, and the S&P 500 itself fell over 2 per cent. Over the same stretch, the equal weight version of the index, which holds all 500 companies in the same size regardless of value, rose nearly 4 per cent.3,4
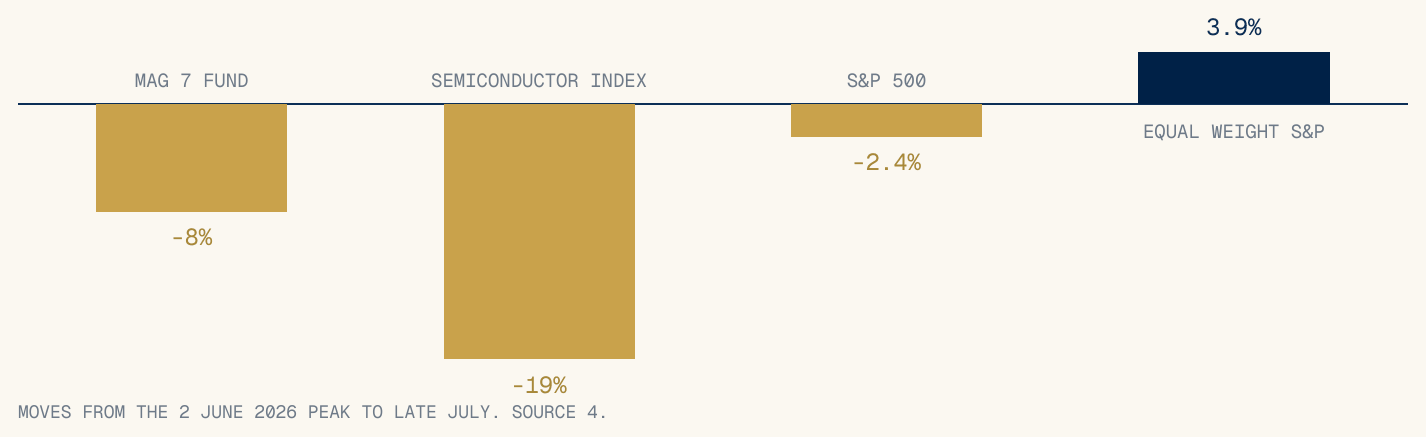
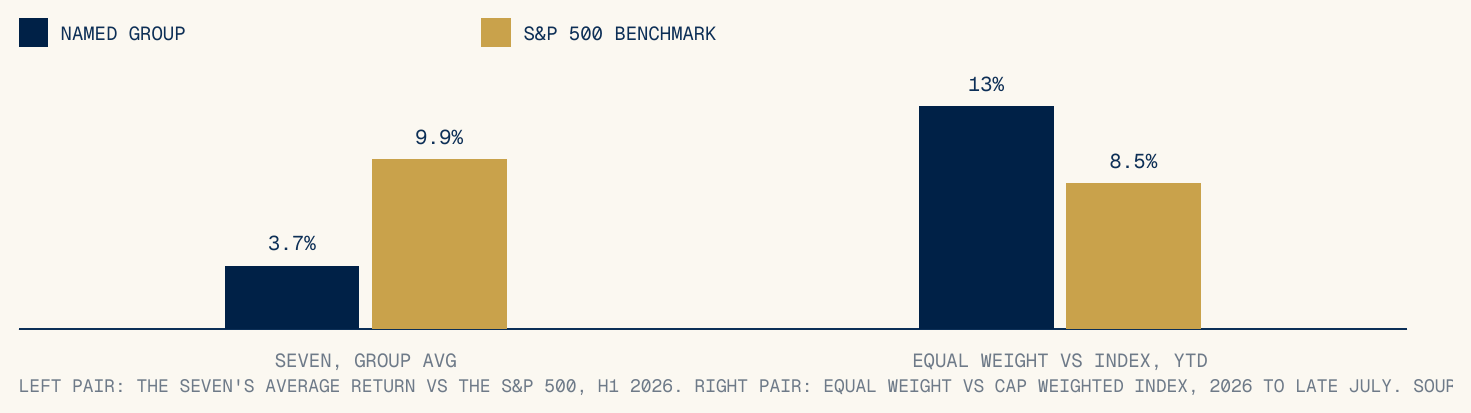
Both charts belong in the same paper. The June episode shows how much of the index’s behaviour is driven by seven names. The half year record shows that the dependence works in both directions, and that positioning against these companies has its own costs. Concentration measures the size of the bet, and the bet can win or lose in any given year.
Section 04
Counting diversification honestly.
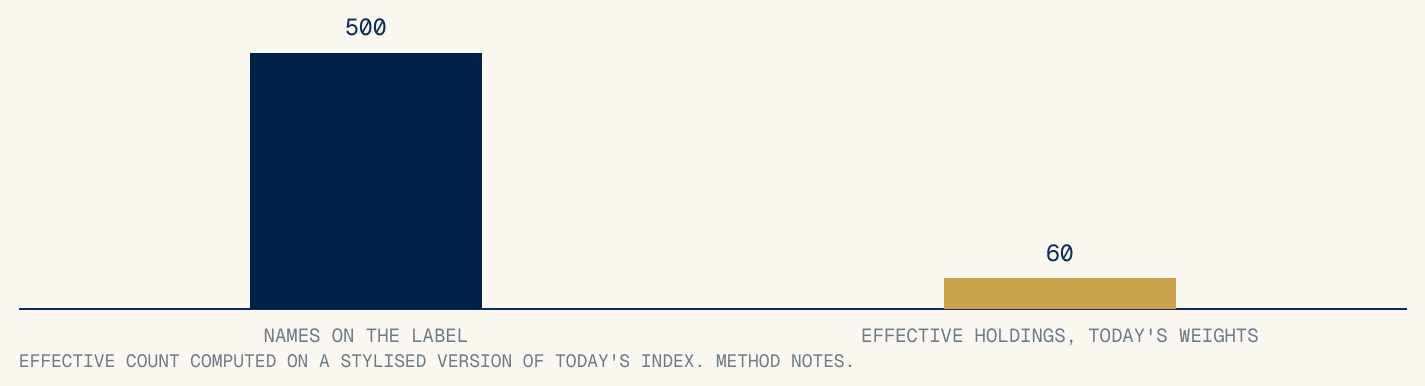
Five hundred companies sounds like five hundred separate investments. A more honest count weighs each company by how much of the portfolio it actually occupies. Statisticians compress this into a single figure called the effective number of holdings: the number of equally sized positions that would give the same concentration.
Plain English · effective holdings
Take each company’s weight in the portfolio, square it, add them all up, then divide one by the total. Equal weights across 500 companies give an answer of 500. Today’s top heavy weights give an answer near 60. The gap between the label and the effective count is the part of the diversification that exists on paper only.
| Question for any diversified holding | Where the answer lives |
|---|---|
| What do the ten largest positions add up to? | Every fund publishes its top ten monthly. Forty per cent is today’s index answer. |
| How much of the portfolio depends on one shared assumption? | Read the top ten’s business descriptions together, as in Section 01’s table. |
| If that assumption repriced tomorrow, do I know my dollar exposure? | Section 02’s table, applied to your own balance. |
Section 05
Where credit sits in this.
A private credit manager publishing a paper about share market concentration owes the reader a straight answer on what is being sold. Here it is: private credit is exposed to the same economy as every other asset. Our borrowers work in it, and our security properties are priced by it. A recession that reaches shares also reaches property and reaches borrowers. What differs is the order of losses. A first mortgage written at 65 to 70 cents per dollar of independently valued property places the borrower’s own equity, roughly the first 30 to 35 cents of any fall, in front of the lender’s money.
| Broad share index | First mortgage held to term | |
|---|---|---|
| What moves the value month to month | Investor sentiment, no default needed | Nothing traded; interest accrues under contract |
| What causes a permanent loss | Buying at prices that later prove too high | Borrower default combined with a fall through the equity buffer |
| Concentration question to ask | Top ten share of the index | One asset class, one country, mostly one city: real, and disclosed rather than denied |
The right hand column’s concentration line deserves emphasis because it applies to us. A fund lending against Sydney property is concentrated, and our answer is the same one this paper recommends for share portfolios: measure it, publish it, and let the investor judge. Our lending criteria and exposures are published under the disclosure list in Paper 06, and our geographic rules in Paper 07.
The useful output of a 40 per cent top ten is a habit, not a transaction: an investor should be able to state, in dollars, how much of their wealth rides on each of the small number of ideas that actually drive it. Some of those ideas are seven companies. One of ours is a city’s property market. The number is the point, in both cases.
Sources and method.
- Forbes, June 2026: the seven at about 34 per cent of the S&P 500, 12.4 per cent eight years prior, first above 30 per cent in 2023; top ten long run average near 24 per cent and 1970 high of 28 per cent, per Visual Capitalist data.
- RBC Wealth Management and Goldman Sachs Asset Management, as reported 2026: top ten above 40 per cent of index weight.
- Market reporting, June 2026: approximately US$2 trillion of combined value shed by the seven in the weeks from the early June peak.
- Reuters, late July 2026: Magnificent Seven ETF down more than 8 per cent from the 2 June peak; Philadelphia semiconductor index down more than 19 per cent; S&P 500 down over 2 per cent against a near 4 per cent rise in the equal weight index; year to date equal weight up more than 13 per cent against about 8.5 per cent cap weighted.
- Investing.com, July 2026: the seven averaging roughly 3.7 per cent for the half against 9.9 per cent for the index.
- Press reporting at 30 June 2026: one of the seven ahead of the index for the half year.
- MSCI World Index characteristics: US weight around 70 per cent. The 30 per cent international sleeve is representative of large Australian balanced options.
Method notes.
Section 02 multiplies three representative weights, 30, 70 and 34 per cent; individual products differ in each link and currency hedging does not change the weight arithmetic. The dollar table scales the same percentages. The effective holdings figure divides one by the sum of squared weights on a stylised index of ten positions at 4 per cent each and 490 positions sharing 60 per cent equally, giving about 60; real index weights are more concentrated than the stylised ones, so the true figure is lower. June and July 2026 market figures are as reported by the sources and were not independently recomputed. Figures may not sum exactly due to rounding.
Disclosure.
This paper is issued by Oxford Capital Pty Ltd (ACN 700 065 872). Oxford Capital Pty Ltd is the investment manager of the fund and a corporate authorised representative (CAR No. 1323556) of Non Correlated Advisors Pty Ltd ACN 158 314 982, AFSL 430126. It does not hold an Australian Financial Services Licence of its own. The trustee of the fund, and the issuer of units in it, is Non Correlated Capital Pty Ltd ABN 99 143 882 562, AFSL 499882. This document is general information and commentary only. It is not financial product advice, does not take into account any person’s objectives, financial situation or needs, and is not an offer or invitation to acquire any financial product. Any interest in a fund managed by Oxford Capital will be offered only to wholesale or sophisticated investors within the meaning of the Corporations Act 2001 (Cth). Oxford Capital is a lender against Australian property and has an interest in investors considering private credit; readers should weigh this paper accordingly. Figures are drawn from third party sources believed reliable but not independently audited. Past performance is not an indicator of future performance. Nothing here is a statement that any investment is safe or that capital is protected.
OC-RP-02 · August 2026 · Second edition