Summary
Australian super funds describe their fixed income holdings as defensive, and for thirty years the description fitted. The Bloomberg AusBond Composite, the standard index for the asset class, posted negative calendar years in 1994 and 1999, both small, and nothing else between 1990 and 2020.1 Then it fell 12.7 per cent from its 2021 peak to its 2022 trough, at the same time as shares were falling, which is the one combination the defensive label exists to prevent.
Plain English · what the index is
A bond is a loan to a government or company that pays fixed interest and repays on a set date. The AusBond Composite bundles several hundred of these loans into one index. When you read that a balanced option holds 25 per cent in fixed income, this index, or something close to it, is usually what that means.
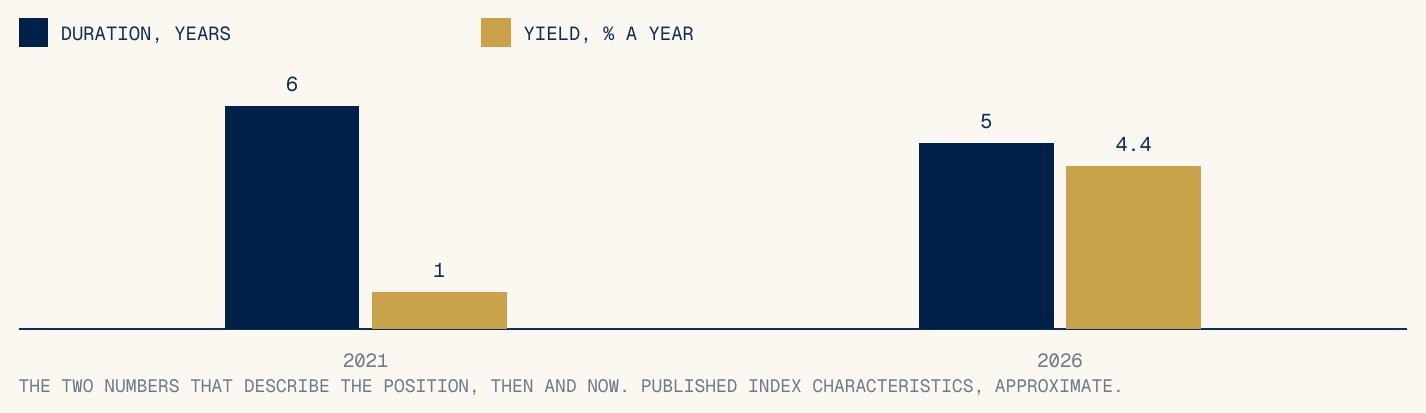
The fall had a specific, checkable cause. The index’s sensitivity to interest rates, its duration, had drifted up through the 2010s as governments and companies borrowed for longer at low rates, while the income the index paid drifted down toward 1 per cent. When the Reserve Bank and world markets lifted rates by roughly 3 percentage points, the prices of all those long, low interest loans adjusted downward together. Paper 01 walks the same mechanism through a single extreme bond; this paper covers the version most Australians actually own.
What this paper does not claim: that 2022 will repeat. Duration cuts both ways, and at today’s yields the cushion is real. The point is that the risk should be held knowingly.
2
Negative years, 1990 to 2020
-12.7%
Peak to trough, 2021 to 2022
~5 yrs
Index duration today, approx
~4.4%
Index yield today, the cushion
Section 01
What the bucket holds.
The index is mostly loans to Australian governments. A little over half is Commonwealth Government bonds, roughly another third is state government paper, and the remainder is high grade corporate and supranational debt.2 Credit quality is strong across the board, and the 2022 fall involved no defaults. The sensitivity that mattered was to interest rates, and it built up gradually.

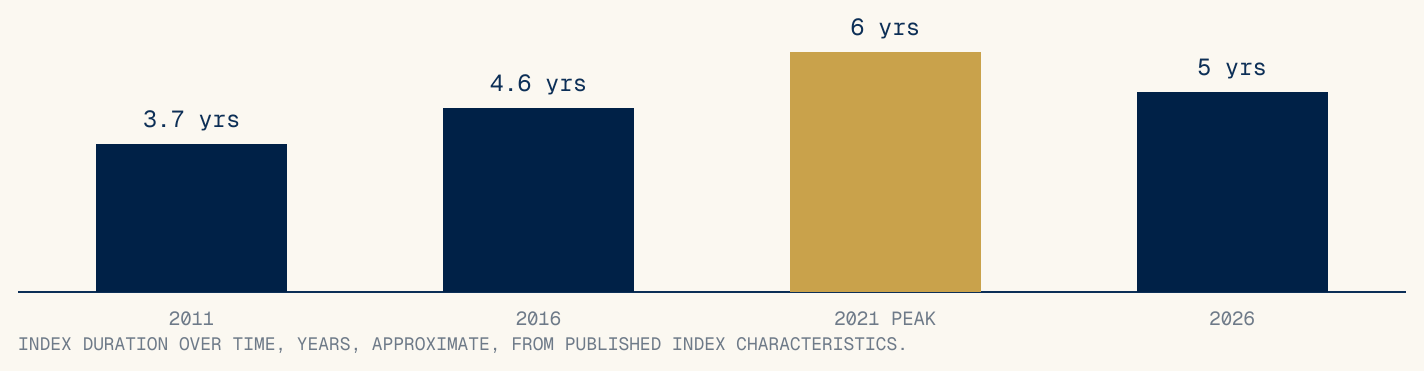
Duration near six years at the 2021 peak meant a portfolio that would fall roughly 6 per cent for each 1 percentage point rise in rates, at a moment when the income on offer to cushion any fall was about 1 per cent a year. Those two published numbers, read together in 2021, described the 2022 result in advance.
Section 02
Pricing a move, in percentages and in dollars.
Plain English · the rule of thumb
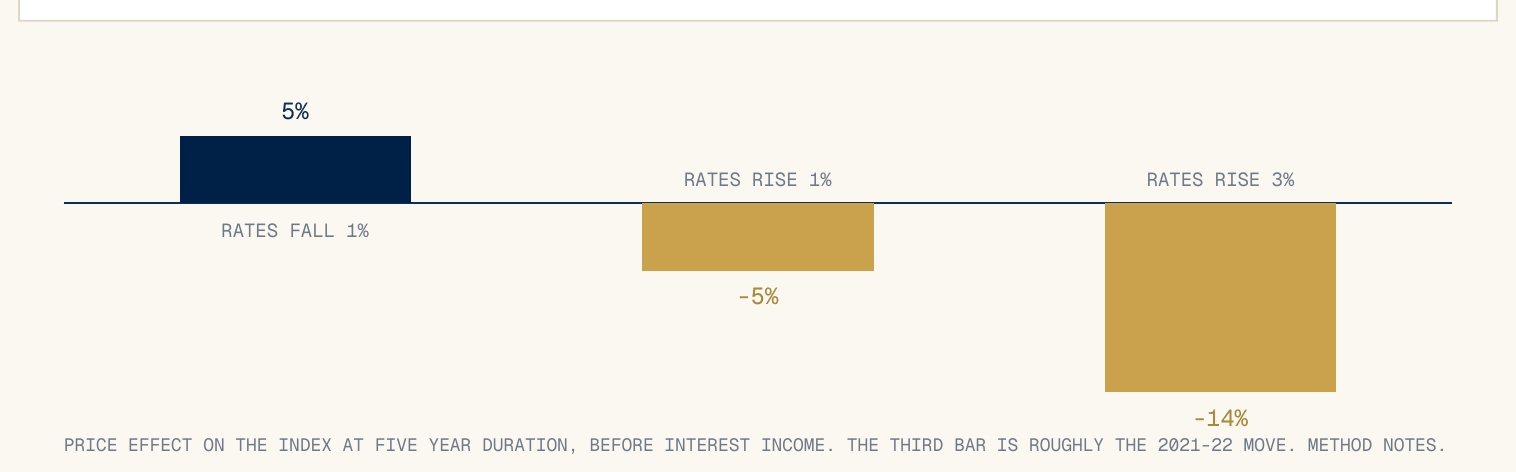
Price change equals duration multiplied by the rate change, in the opposite direction. A five year duration and a 1 percentage point rise gives roughly a 5 per cent price fall. A 1 point fall in rates gives roughly a 5 per cent gain. Income earned along the way offsets either result.
| Scenario over one year | Price effect | Interest income | Approx total | On $125,000 of index exposure |
|---|---|---|---|---|
| Rates unchanged | 0% | +4.4% | +4.4% | +$5,500 |
| Rates fall 1 point | +5% | +4.4% | +9.4% | +$11,750 |
| Rates rise 1 point | -5% | +4.4% | -0.6% | -$750 |
| Rates rise 3 points | -14% | +4.4% | -9.6% | -$12,000 |
The third row is the important one for today’s holder. At current yields, the income roughly cancels the price damage of a full 1 point rise over a year. In 2021 the same row computed to about minus 5 per cent, because the income line was close to zero. Today’s index is a much better cushioned version of the same position, and the table is the honest way to show it.
Section 03
The position, stated out loud.
A member holding the index owns a position that gains about 5 per cent if long term rates fall 1 point, loses about 5 per cent if they rise 1 point, and earns about 4.4 per cent a year while waiting. Written out like that, it is a reasonable holding, and at today’s yields a genuinely useful one. The audit’s finding is about how the position was acquired: it accumulated through index drift over a decade, and most of its holders learned its size from their 2022 statement.
| The three numbers to check yearly | Today’s answer for the index | What to do with it |
|---|---|---|
| Duration, in years | About 5 | Multiply by 1 point to know your downside from a rate rise. |
| Running yield | About 4.4% a year | This is the cushion that offsets price falls while you hold. |
| Your allocation, in dollars | Your statement | Converts both percentages into money on your own balance. |
Our position in this discussion should be stated plainly. Oxford lends money against property; a held to term first mortgage carries repayment risk instead of repricing risk, and Paper 01 prices that trade in both directions. We are a participant in the comparison, and the same standard applies to us: name the risk, size it in dollars, and hold it on purpose. This paper is the bond side of that standard.
Sources and method.
- Bloomberg AusBond Composite 0+ Yr Index, total return series: negative calendar years 1994 and 1999; peak to trough fall of 12.7 per cent across 2021 to 2022.
- Published index characteristics and provider factsheets: issuer composition, duration and yield, approximate, as charted.
- RBA statistical tables: the rise in Australian yields of roughly 3 percentage points across 2021 and 2022.
Method notes.
Composition and duration figures are rounded and indicative; they move month to month. Price effects use the linear rule of thumb, duration times rate change; the minus 14 per cent figure for a 3 point rise slightly overstates the pure price effect because the rule of thumb is pessimistic for large moves, and 2022’s realised result also included income. The dollar table applies percentages to a $125,000 exposure, being 25 per cent of a $500,000 balance, and rounds to the nearest $250. Figures may not sum exactly due to rounding.
Disclosure.
This paper is issued by Oxford Capital Pty Ltd (ACN 700 065 872). Oxford Capital Pty Ltd is the investment manager of the fund and a corporate authorised representative (CAR No. 1323556) of Non Correlated Advisors Pty Ltd ACN 158 314 982, AFSL 430126. It does not hold an Australian Financial Services Licence of its own. The trustee of the fund, and the issuer of units in it, is Non Correlated Capital Pty Ltd ABN 99 143 882 562, AFSL 499882. This document is general information and commentary only. It is not financial product advice, does not take into account any person’s objectives, financial situation or needs, and is not an offer or invitation to acquire any financial product. Any interest in a fund managed by Oxford Capital will be offered only to wholesale or sophisticated investors within the meaning of the Corporations Act 2001 (Cth). Oxford Capital is a lender against Australian property and has an interest in investors considering private credit; readers should weigh this paper accordingly. Figures are drawn from third party sources believed reliable but not independently audited. Past performance is not an indicator of future performance. Nothing here is a statement that any investment is safe or that capital is protected.
OC-RP-03 · August 2026 · Second edition